Source: MMGY Global
According to MMGY Global's "New Insights from the 2016-2017 Portrait of American Travelers" infographic, travel expectations are rising. This newly released study features some powerful shifts in recent travel perceptions. It's important for travel brands to know what changes are arising among their consumers, so keep reading for the latest insights on the 2016-2017 American Traveler.
Intent to Travel & Spend
The percentage of travelers planning to vacation more in the next 12 months has increased significantly. After dropping from 27% to 16% between 2008 and 2010, it has now jumped from 24% in 2015 to 28% in 2016. Spending among travelers has increased as well. From an average of $4,742 in 2015, travelers now plan to spend even more on vacations... $5,182 for 2016!
What does this mean?
Americans Travelers are at it again. Not only are they traveling more, but they're spending more.
Top Microsegments Driving Increases in Travel This Year:
1. Children 12 and Under - Young kids that influence family travel decisions
2. High Earners Who Aren't Rich Yet - These travelers are young, affluent, and have not yet accumulated personal wealth. 69% of them expect personalized attention and options while on vacation.
3. "Young at Heart" Travelers - Active retirees traveling more than 3 times per year. $8,032 is the amount they intend to spend on vacation annually.
4. Those Who Don't Bring Their Family While Traveling - These travelers are closely correlated with age, primarily Millennials or Xers. Among this category, there has been a 61-point net increase in intent to take more vacations this year.
5. Adults With No Children - Traveling for their own pursuits. Among this category, 3-5 vacations were taken on average in the last 12 months.
32% of travelers use the official website of a brand to plan their trip. 21% of travelers turn to online travel agencies for inspiration online. Meaning: There are other resources that travelers use besides just the brand's website. So, don't limit your travel brand to just online marketing. Face-to-face marketing is the most effective way to successfully market your travel brand. Today's travelers are looking for personalization, inspiration, and self-discovery. More and more travel brands are helping consumers personalize their dream vacation at the Travel & Adventure Show.
Who Are Travel & Adventure Show Attendees?
After 13 years and 68 shows, the Travel & Adventure Show team has painted a very accurate portrait of the travelers who attend the shows.
Among TAS attendees:
63% are female
63% are married or in a committed relationship
79% are age 35+ in peak earning years
85% Hold a college degree
56% Make over $100k/year
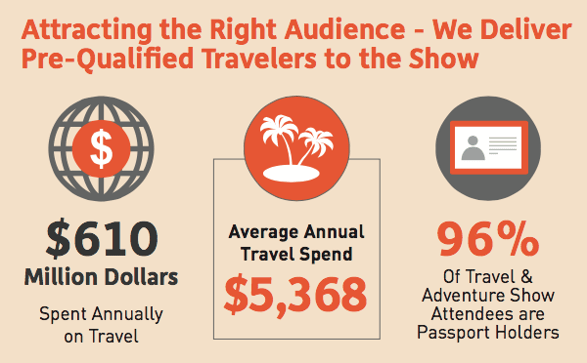
The average traveler for 2016 plans to spend $5,182 on travel this year, compared to $5,368 for TAS attendees.
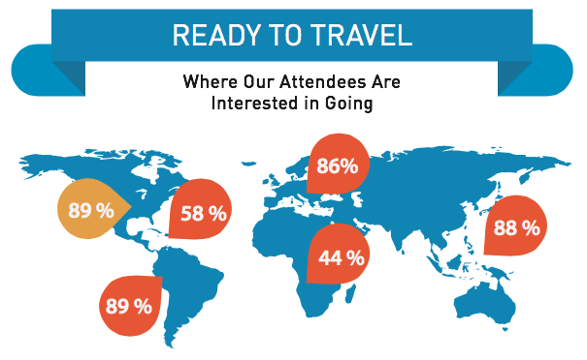
Where are TAS attendees interested in going?
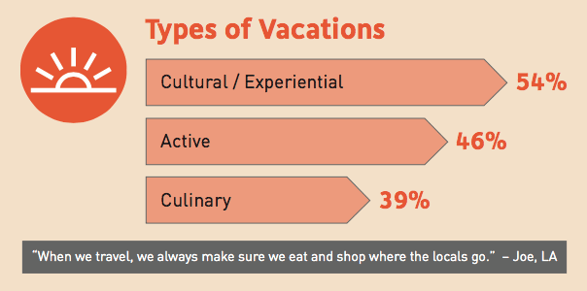
What kind of vacation do they want?
After the Travel & Adventure Show...
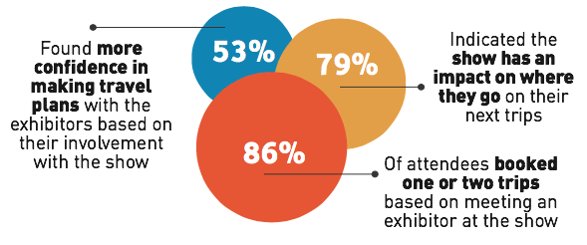
Why should your brand be a part of this?
Among TAS attendees, 89% of those looking to book a trip, booked with an exhibitor they met at the show. 78% will book that vacation through a destination specialist of supplier they met at the show. 71% will book this vacation within a year. 72% of attendees spent $2,000+ on EACH TRIP booked after meeting at the show. The Travel & Adventure Show sets you up for success. What are you waiting for? Book a show to target today's American travelers.
Before they went here:

They came here:
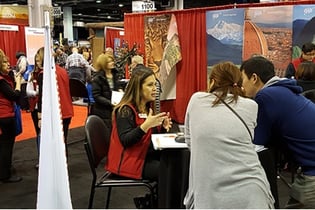
Travel & Adventure Show
The Nation's #1 Series of Travel Shows
-Place Your Brand in Front of a Live Audience
-Meet Over 140,000 Ready-to-Book Travelers
-Watch Your Business Succeed


